
In a rapidly evolving world driven by data, the ability to transform intricate datasets into meaningful insights is a skill in high demand. This article introduces a Power BI project that offers a comprehensive exploration of data analytics, highlighting not only the capabilities of Power BI but also the art of interpreting and presenting complex data. Within these pages, we will embark on a journey through the project’s objectives, critical measures, and impactful visualizations, all designed to empower decision-makers in the transportation industry.
Project Overview
Power BI Dashboard
Our Power BI dashboard is a multifaceted tool that empowers transportation companies to make informed decisions. It comprises two main sections: the “Drivers Dashboard” and the “State Analysis.”
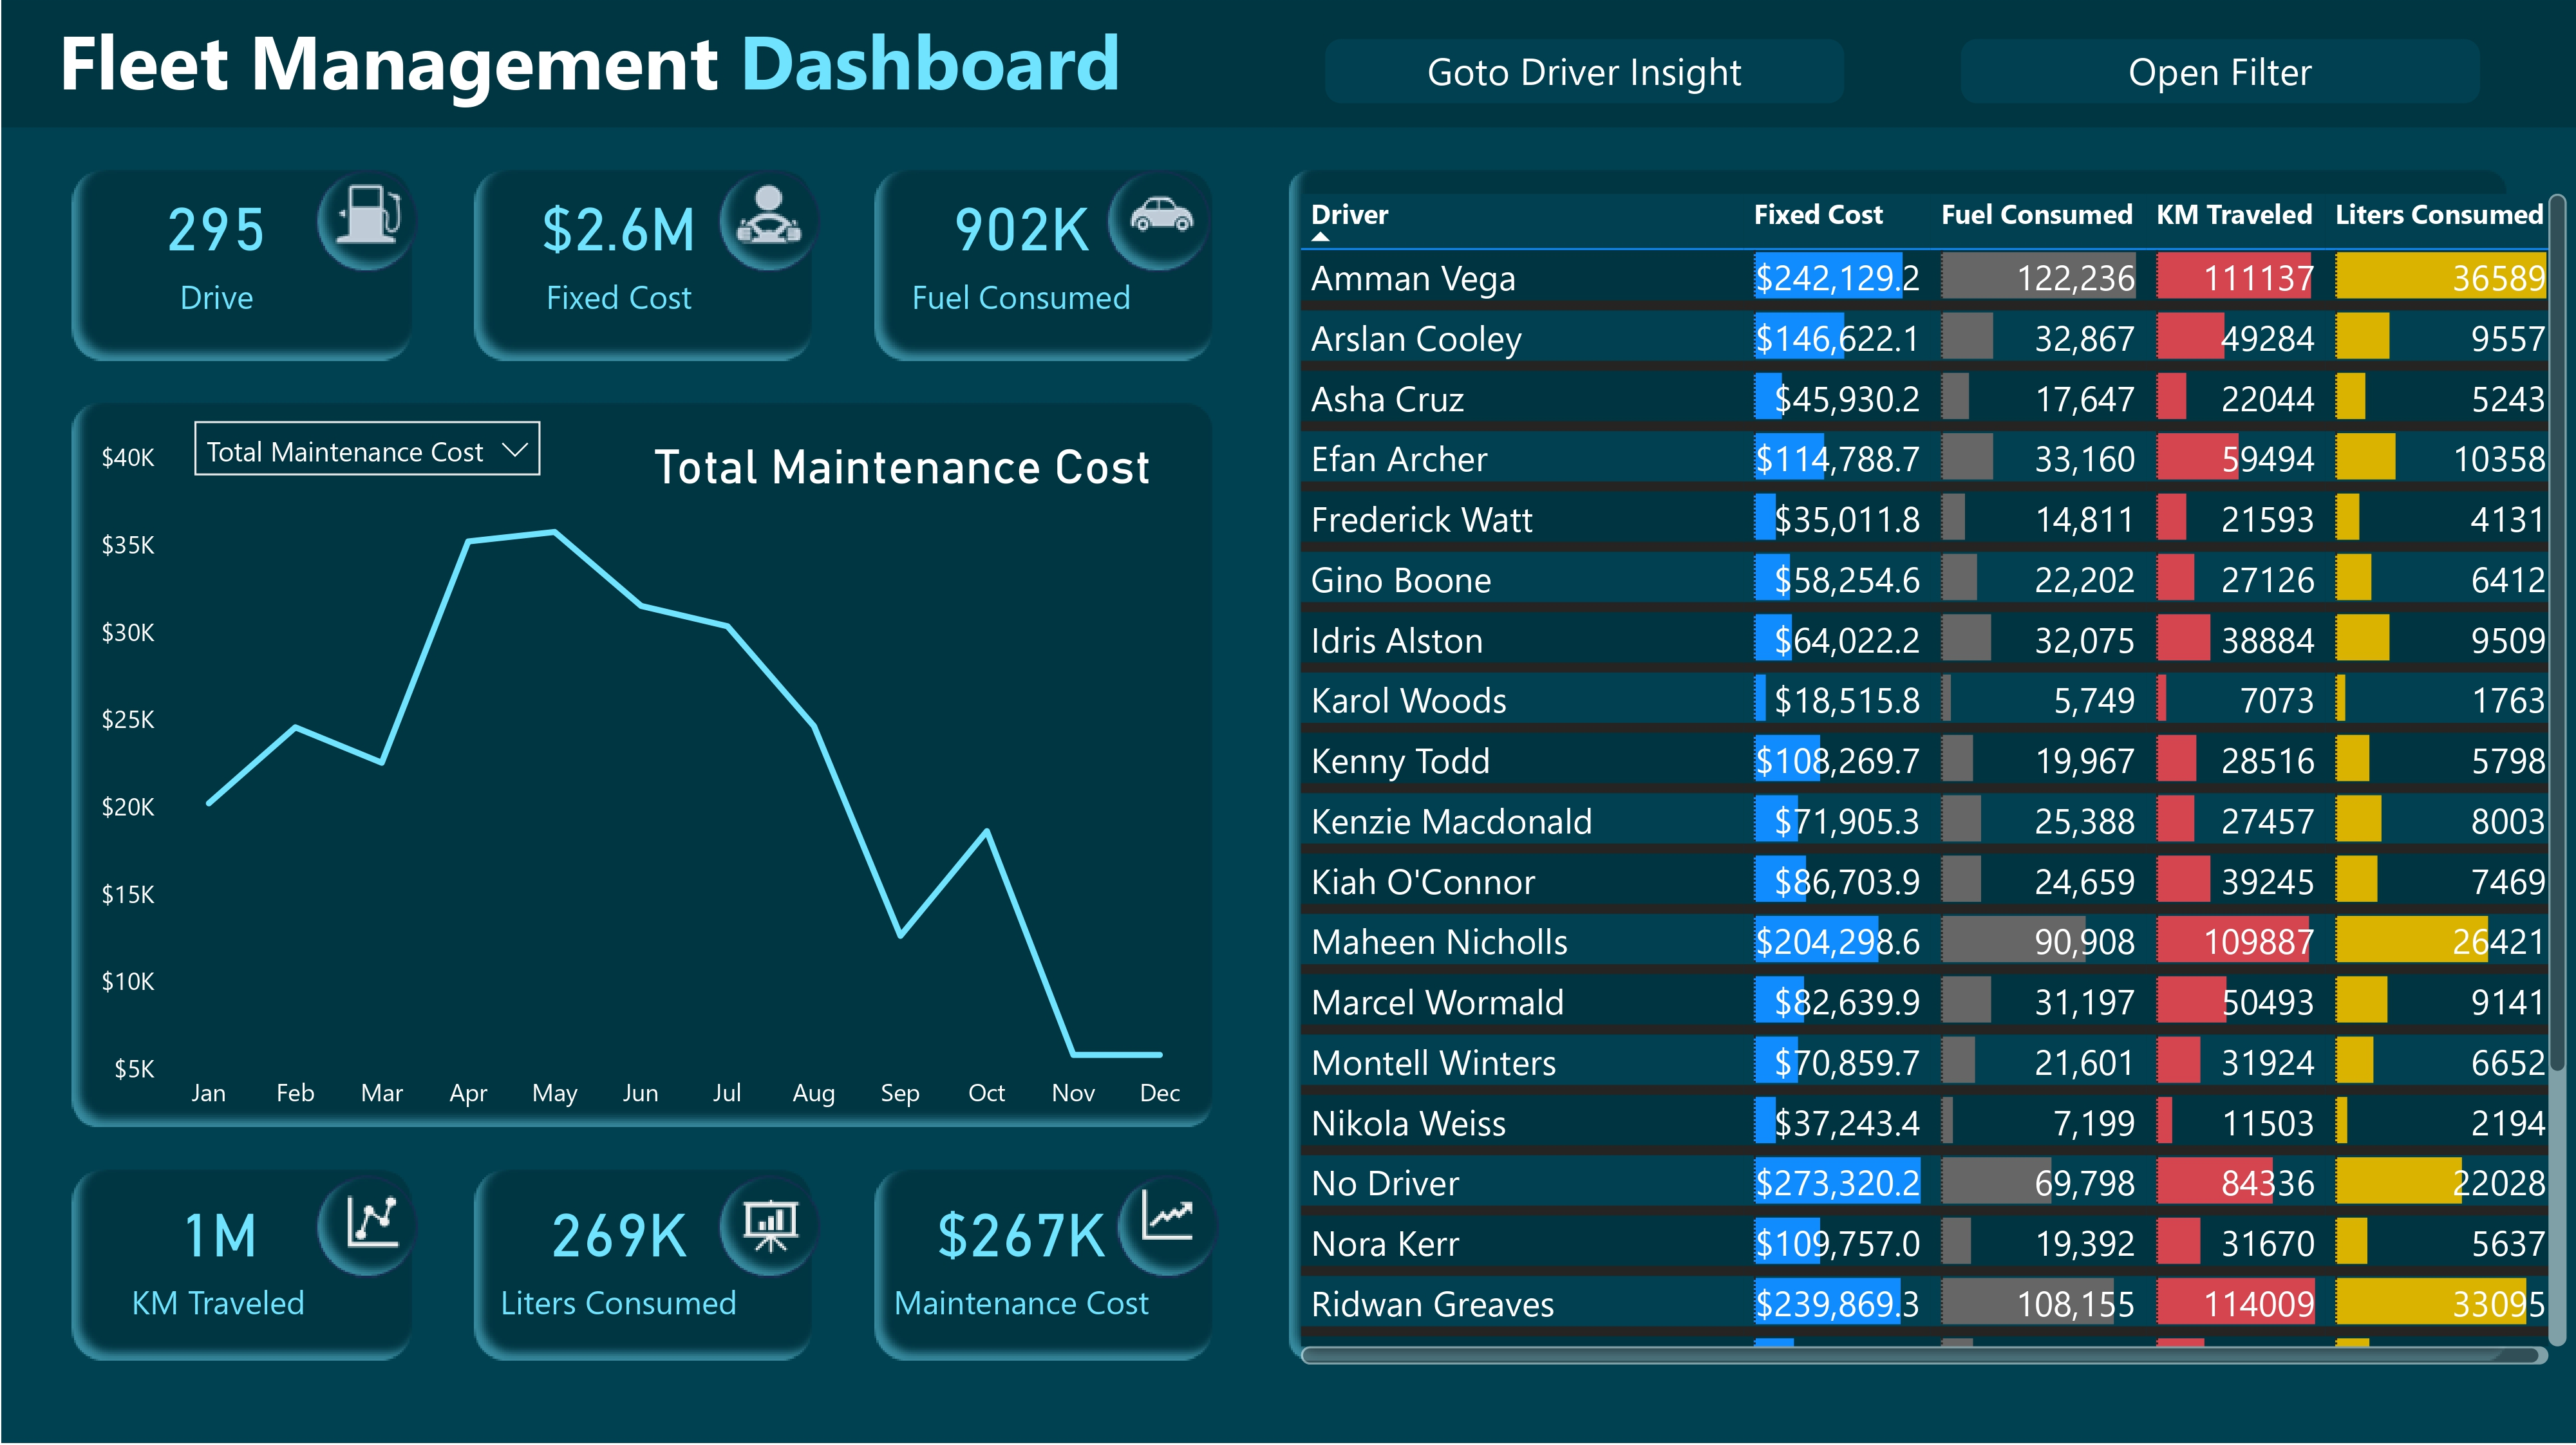
Drivers Dashboard:
Metrics: A summary of key metrics for drivers, including the total number of drives, total fixed costs, total fuel consumption, total kilometers traveled, total liters consumed, and total maintenance costs. Graphs: Visualizations that allow for a temporal analysis of the mentioned metrics. Additionally, a dynamic selector is provided to choose which metric to display, enhancing interactivity. Table: A detailed table showcasing individual driver data and the aforementioned metrics, offering a comprehensive view of driver performance.
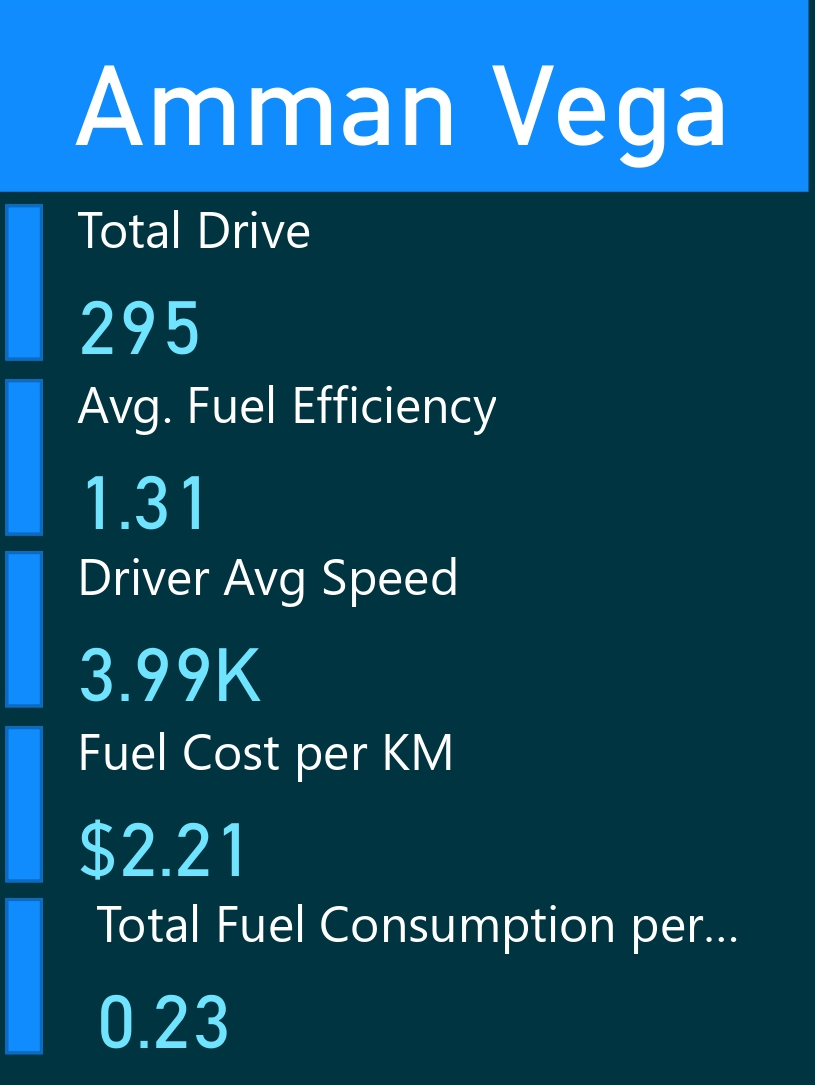
Tooltip:
When hovering over the driver table in the Drivers Dashboard, a tooltip displays driver-specific information, including the driver’s name, total drives, average fuel efficiency, average speed, fuel cost per kilometer, and total fuel consumption per kilometer. This feature enhances the user experience and provides instant insights.
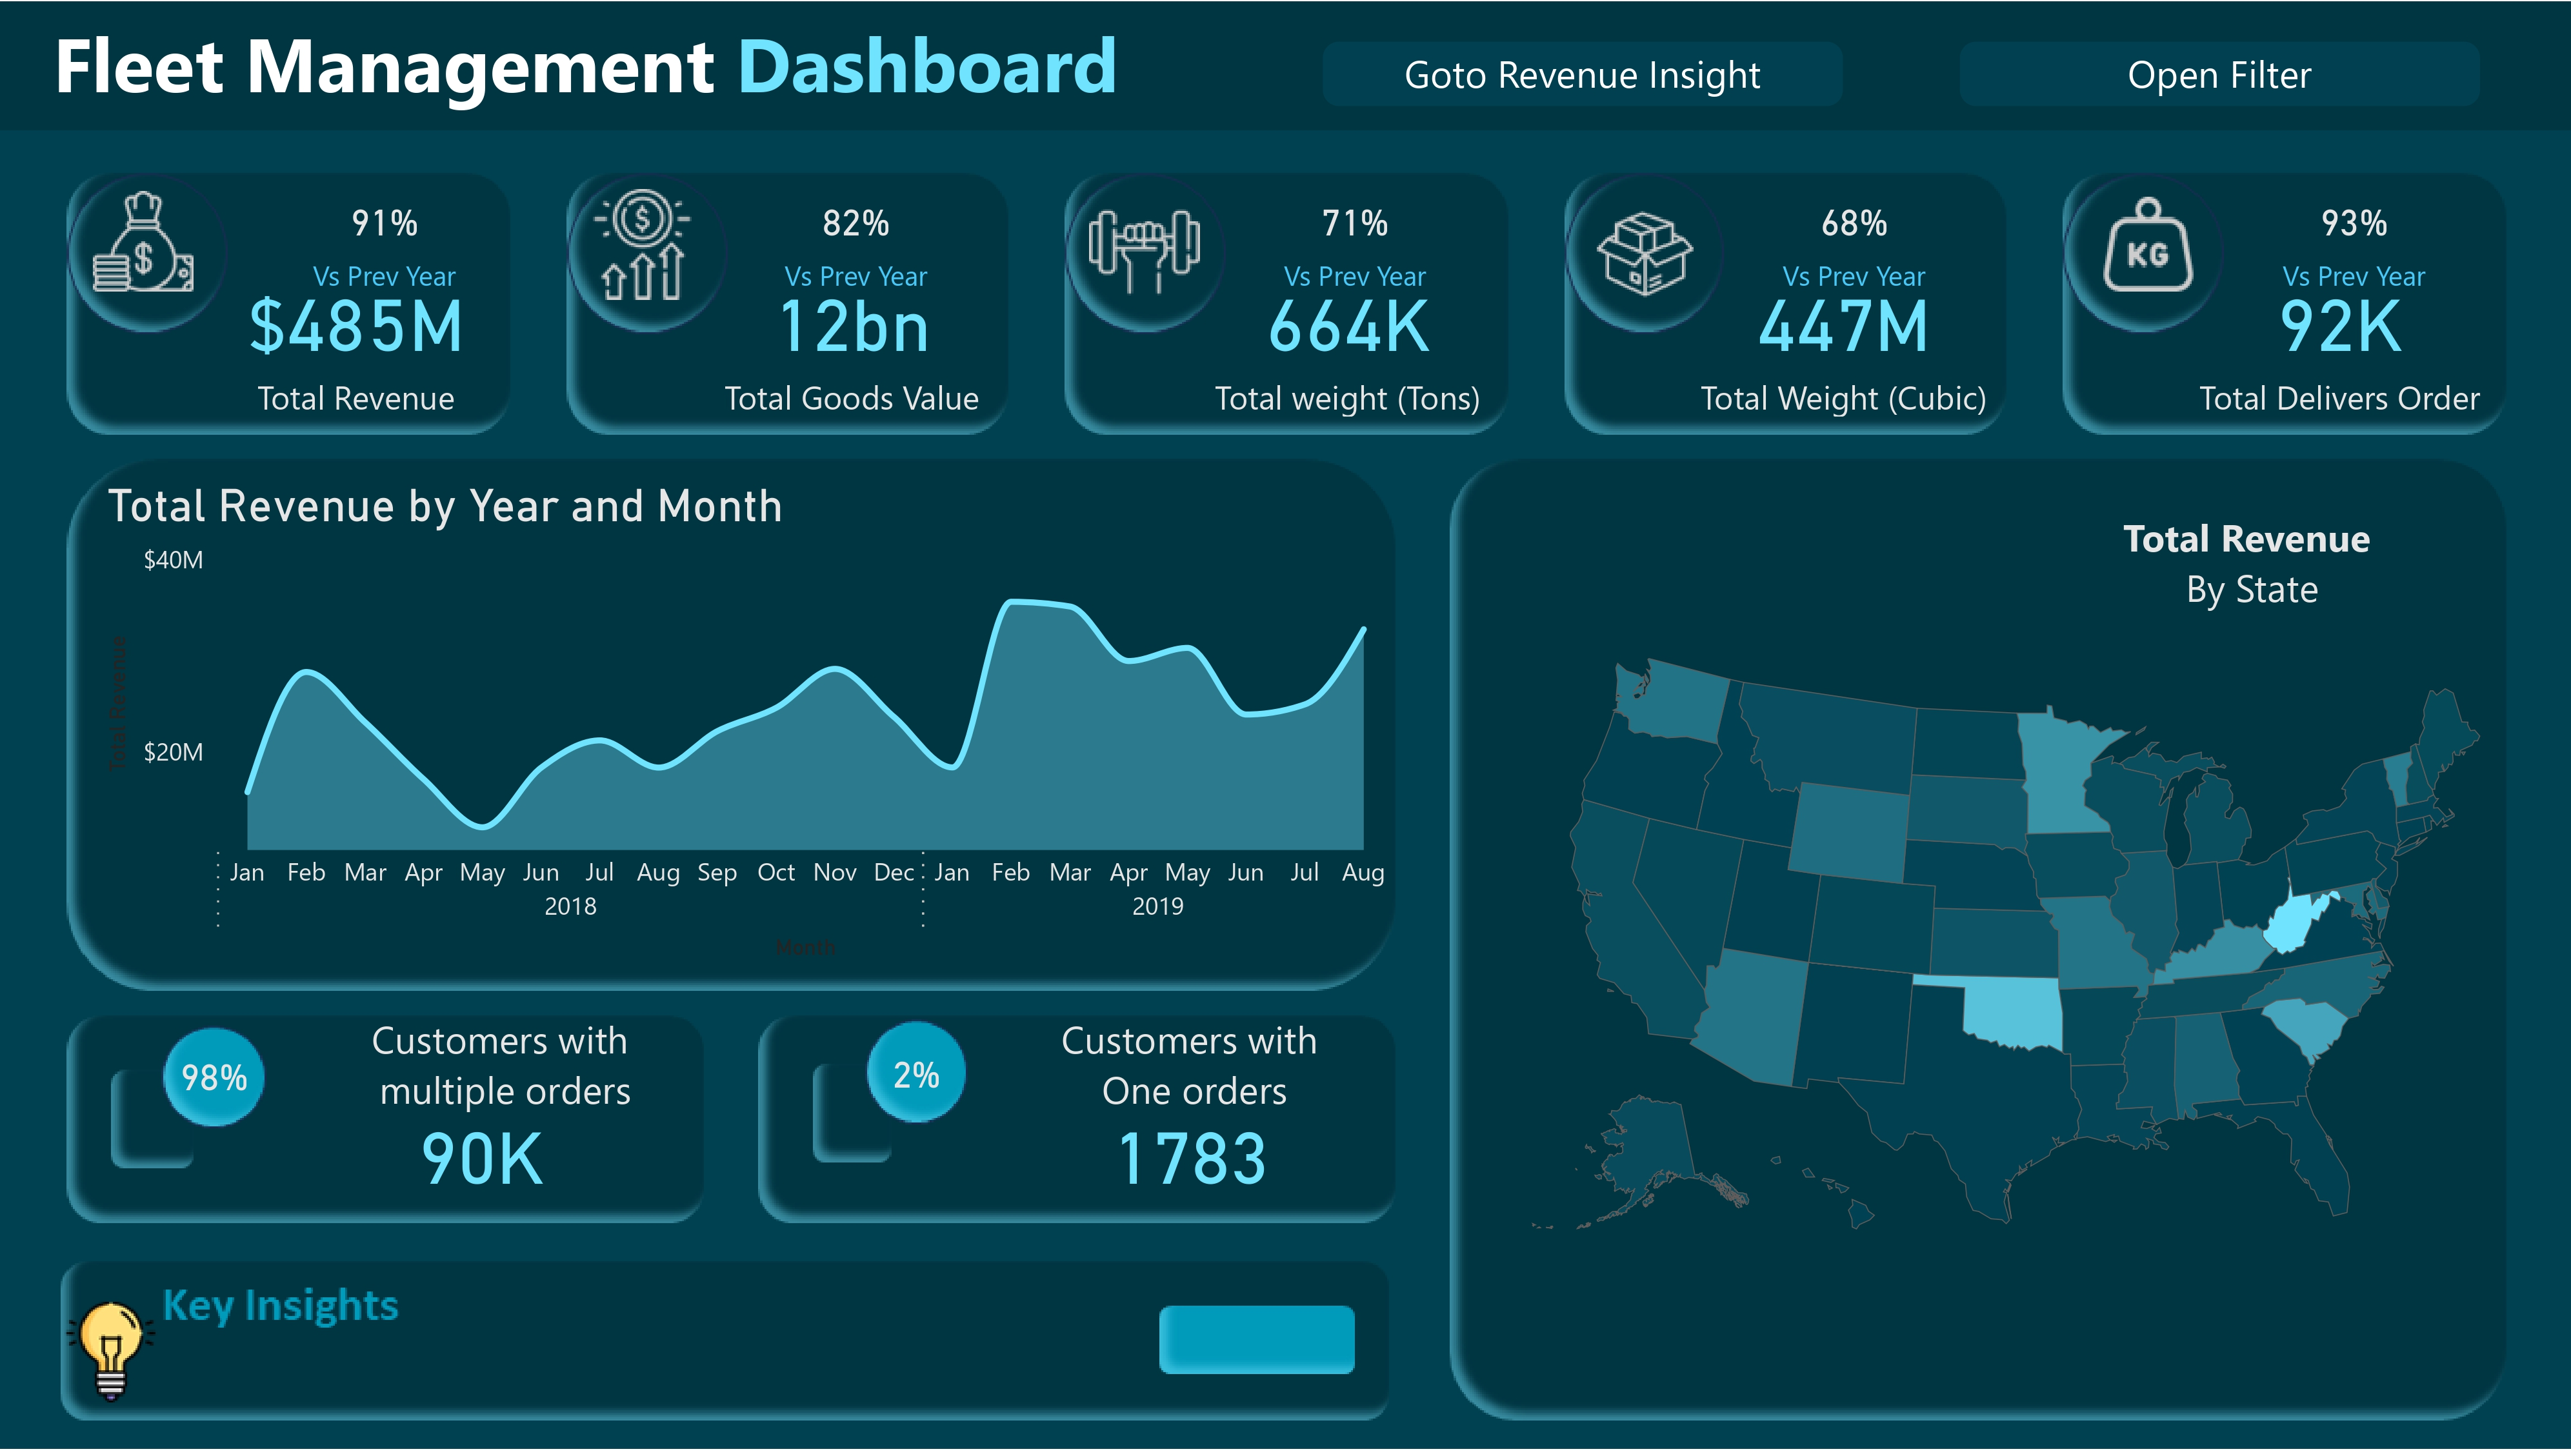
State Analysis:
Metrics: An overview of key metrics related to the company’s operations across different American states. This includes total revenue, total goods value, total weight in tons and cubic units, the total number of delivery orders, and customer analysis metrics. Graphs: A map displaying total revenue by American states and line charts showing total revenue trends over different timeframes (year, month, quarter).
Data Sources
The project draws from a diverse set of data sources, including:
Dim_Customers: Providing insights into customer demographics.
Dim_Vehicles: Offering essential information on the company’s fleet.
Dim_Drivers: Containing driver-specific data.
Fact_Freight: Delivering valuable information on freight.
Fact_KMTraveled: Detailing kilometers traveled and related data.
These data sources form the foundation for our analytics, enabling us to derive meaningful insights.
Key Metrics and Measures
A key aspect of our project is the definition of essential measures to analyze data effectively. Let’s delve into some of the critical measures that underpin the dashboard:
Total Drive: This measure counts the total number of drives by drivers, offering a fundamental performance metric.
Total Drive = COUNT(Fact_KMTraveled[Driver ID])
Total Fuel Consumed: This measure sums up the total fuel consumed by drivers, a critical cost component.
Total Fuel Consumed = SUM(Fact_KMTraveled[Fuel])
Total KM Traveled: This measure calculates the total distance covered by drivers, crucial for assessing productivity.
Total KM Traveled = SUM(Fact_KMTraveled[KM Traveled])
Total Revenue: Summing up the company’s total revenue, this measure is essential for assessing financial performance.
Total Revenue = SUM(Fact_Freight[Net Revenue])
Total Weight (Tons): This measure calculates the total weight in tons, helping to understand load distribution.
Total weight (Tons) = SUM(Fact_Freight[Weight (Kg)]) / 1000
% of One-Time Customers: This measure computes the percentage of customers who made a single order, offering insights into customer retention.
% of One-Time Customers = (100 - [% of Repeat Customers] * 100) / 100
These measures, along with others, create a robust framework for analyzing transportation data and deriving actionable insights.
Conclusion
In a fast-paced world where data reigns supreme, the ability to transform intricate datasets into actionable insights is a skill of immense importance. Our journey through this Power BI project has illuminated the immense potential that data analytics holds for the transportation industry. This project not only showcases the prowess of Power BI as a dynamic tool for data analysis and visualization but also underscores the art of interpreting and presenting complex data in a way that empowers decision-makers in the transportation sector.
The Power BI dashboard presented here is a versatile tool, split into two key sections: the “Drivers Dashboard” and the “State Analysis.” These sections cater to the diverse needs of transportation companies, offering a comprehensive view of driver performance and a detailed analysis of operations across different American states. The dynamic visualizations and user-friendly features ensure that decision-makers can access critical information at their fingertips.
The power of data-driven decision-making is further exemplified through the definition of key metrics and measures. These essential measures, such as Total Drive, Total Fuel Consumed, Total KM Traveled, Total Revenue, and more, serve as the foundation for meaningful data analysis and decision support. By harnessing these measures, transportation companies can optimize their operations, enhance efficiency, and make informed choices.
The project draws its strength from diverse data sources, including Dim_Customers, Dim_Vehicles, Dim_Drivers, Fact_Freight, and Fact_KMTraveled. These sources provide the necessary data foundation, allowing for deep insights into customer demographics, fleet management, driver-specific data, freight details, and kilometers traveled.
In conclusion, this Power BI project serves as a testament to the transformative potential of data analytics in the transportation industry. It is a dynamic tool that equips decision-makers with the information they need to streamline operations, improve driver performance, and enhance the overall efficiency of their logistics and transportation businesses. The project’s ability to bridge the gap between data and actionable insights is a powerful asset in today’s data-driven world, where informed decisions are the cornerstone of success in the transportation sector.